TABLE OF CONTENTS
Overview
This article explains how to onboard Netskope as a cloud device into ADR. It covers both the UI provisioning workflow and the programmatic (API) method, verification steps, troubleshooting, security considerations, and frequently asked questions. Use this article as a reference for operations, onboarding, and documentation handoffs.
Pre-requisite
ADR tenant access with provisioning privileges.
Netskope account permission to generate API tokens for Private Access REST APIs.
Access to CCE (Collection and Control Engine) IP.
Firewall configuration allowing outbound HTTPS connections on port 443.
Integration Steps
Create Netskope API Token (Netskope console)
Log into the Netskope console.
Navigate to Private Access → REST APIs (or Token Management depending on the UI version).
Create a new token (Token ID) and grant permissions to read the event endpoints listed in the summary.
Refer REST API v2 Overview section as mentioned in https://docs.netskope.com/en/private-access-rest-apis/ to generate the Token ID
Note- Give the following permissions during Token Creation or After Token Creation:
/api/v2/events/data/alert
/api/v2/events/data/network
/api/v2/events/data/application
/api/v2/events/data/page
/api/v2/events/data/audit
/api/v2/events/data/infrastructure
ADR GUI Configuration for Netskope
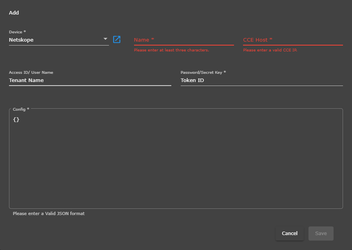
- On UI navigate to
>> Inside respective tenant >> Administration >> Add on devices >> Add on Configuration
- You will get a list of cloud devices, select Netskope
- Enter the name of the device
- Enter the CCE IP
- Now enter the Tenant Name in Access ID/user name (only hostname, without domain) and generated Token ID in the password/Secret Key section
Where can I find the tenant name?
Find the tenant name in the URL you use to access Netskope; for example, https://<tenant>.goskope.com.
- Now valid JSON Format in the last field, no need to put JSON ( only Add- {} )
- Click on the Save button
Verification (MSSP Only)
- Login into ADR GUI Console with appropriate administrative priviledges
- Go to the System tab in the Logs/Flow Collection tab, and check the Netskope in the Device Name column.
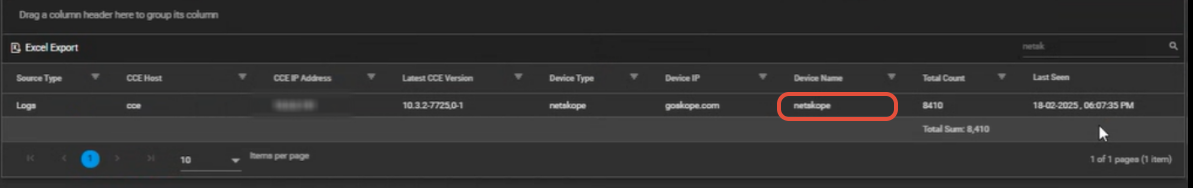
Integration Successful:
- Netskope device appears in the source device list
- Log collection status shows "Active" or "Running"
- Netskope logs are appearing in ADR
- No authentication errors in the system logs
Was this article helpful?
That’s Great!
Thank you for your feedback
Sorry! We couldn't be helpful
Thank you for your feedback
Feedback sent
We appreciate your effort and will try to fix the article